
What is your ideal city to live in? Well, it might be a good idea to start with the daily hassle of “going to” and “getting home from” work.
Despite this being an unusual year when for months many of us have simply “gone to work” in our home office or a corner of the living room or equivalent (“WFH” or the “zero-minute commute”!), many of us will have to think about the “daily commute” again as Covid gets under control and we return to “a new normal” even if that is a redefined and reconfigured version of what we’ve known before Covid (more acronyms as in “BC” and “AC”).
To us, being able to get around with relative ease (and not too much “hassle”) – including to and from one’s work-place – is definitely an important element of a city’s “liveability”. But of course many of us city-dwellers experience a lot of stresses during the “travail” of getting from home to their work-place, before their official travail. (Indeed, the origin of the word “travel” comes from the old French word “travail”, which means work!).
We ask: Can cities make the commute less stressful? Is biking or walking to work a better option, and can they be made feasible?
This requires us to ask: how do inhabitants of the many cities around the world travel to and from work? And what do those commuting experiences feel like? How do the different cities compare?
To answer these questions, we took a spin across the globe and captured snapshots of the travails before and after the proper travail. We travelled all the way from Copenhagen to Paris to London to Beijing to New York to Tokyo and others, and we found interesting trends, a diversity of solutions, and many other interesting and fascinating facts on the way.
Let’s go.
I. 41% of Copenhageners spin over to their offices on their bikes
Despite the low cycling statistics for two of the
We cannot not start with C O P E N H A G E N. Copenhagen is the world’s best city for bike share of commuting, at 41%. With some understandable data discrepancy, the city of Copenhagen’s numbers tell us that in 2018 49% of all trips to work and education were done by bicycle (41% goes by person while the 49% is by trips).
Either of these are amazingly high numbers …
41% of Copenhageners commute by cycling.
As far as we know, this is the highest amongst cities; in other words, Copenhagen can safely be crowned the city of bikes! (And yes Copenhagen beats Amsterdam, another one of the cycle super-cities in popular understanding and with a 31% cycling modal share).
We have also learned the amazing statistics that 97% of Copenhageners are satisfied with the cycling conditions in the city. Moreover, the long, dark, nasty Danish winters do not stop them: of those that do cycle, three quarters continue to do so through the winter.
This love for bikes can also be seen in bikes outnumbering cars in Copenhagen by a factor of around 5, with many Copenhageners not owning cars.
In late 2016, Copenhagen reached the significant milestone of bikes crossing into the city center outnumbering cars for the first time since 1970. Indeed, not only is the bike share of commuting high, the city collects data on bikers – it has sensors under the asphalt of bike lanes and does regular counts at around 200 locations across the city.
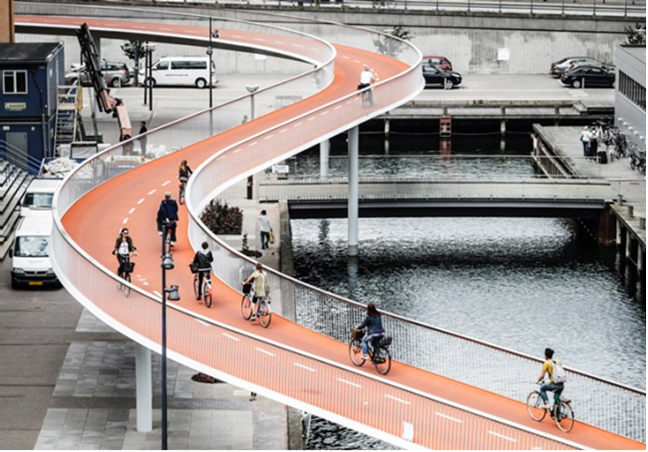
Image credit: Topos Magazine
We love the city’s iconic “bicycle snake”, a 220-metre elevated cycle-only bike bridge right downtown that takes cyclists on a ride criss-crossing 7 meters above one of the harbour baths in between Fisketorvet Shopping Mall and other buildings down towards the harbour with perfect vistas of the harbour and the city’s many spires. Another wonderful cycle path takes in the 3 km-long beach-front promenade along Amager beach with great view to the Øresund bridge and the windmills.
Copenhagen’s commuters who use bikes do so because “it’s faster” (53%), followed by “it’s easier” (50%), “for the exercise” (40%) and “it’s cheap” (27%) and “it’s convenient” (23%) and “it’s eco-friendly” (7%).
It’s faster. (#1 reason for biking to work or school for Copenhageners).
And in this city where so many already cycle to work, when asked what is the #1 thing that would make them cycle more, Copenhageners answered: “more cycle tracks” (a clear winner at 44%)! In fact, the city government has pledged investments equalling more than €40 per capita in bicycle infrastructure investments. It is not only bicycle-friendly but often bicycle-first.
More cycle tracks. (#1 thing that would make Copenhageners cycle more).
In addition, the steady increase in cycling in Copenhagen has come with a reduction in fatalities and a steady increase in satisfaction. Is this the model of the smart city or what some has called “bicycle urbanism”?
II. Very trendy in Paris
But of course, many of the world’s top cities have a larger population (and are more densely populated) than Copenhagen. Is more commuting by bike possible in these cities?
It is perhaps in the capital of fashion, P A R I S (with a population that is more than 3 times that of Copenhagen), where the concept of biking has become newly trendy and has made some of the most significant progress in recent years.
The numbers are still low though: in this city that has been making much waves about cycling, the cycling modal share for the daily commute is only still below 5% (even if it is certainly above the national average) and in fact was only around 3% before bike use was pushed up by 54% in the space of one year because of the widespread transportation strike of 2019 that was preceded by an expansion of bike space through 2018, which in turn meant thwarted Parisians saw cycling as an alternative for their transit.
This was helped by Paris being the city where one of the world’s first biking sharing schemes was launched – it was in 2007 when the city’s famous bike share scheme, Vélib’, was launched, and it remains one of the world’s most used and ambitious, with over 150,000 members, over 1,200 stations across the 54 municipalities of Grand Paris and an additional 2,500 or so e-bikes within the existing 18,000+ fleet, and a reported daily ridership of over 100,000.
In fact, it is almost impossible to imagine how audacious it was when Vélib launched. The name combining the French word for “bike”, vélo, with the word for “liberty”, the scheme was launched at a time when just 1% of Parisians used bikes as their primary mode of transport. But success came fast: there were more than three million rentals in the first month; 200,000 Parisians had signed up within a year. Vélib’ revolutionised Paris – despite vandalism issues and the chaos to do with the transition to a new operator, amongst other major and minor debacles – and it also inspired the world.
Paris went on to build a cycle lane network, launching ambitious plans to double the length of cycling lanes in 5 years and more recently a “train and bike” scheme (the so-called “RER-V network”) that is really about bike-travel connectivity (as Paris is a magnet for workers and visits from a much larger region). A recent milestone was the opening in 2018 of a dedicated two-way bike path on the famed rue de Rivoli, which runs along the Louvre museum and Tuileries Gardens, and a four-kilometre track between the western suburb of Boulogne and the Pont de Bir-Hakeim.
And, seriously monsieurs et madames, bike shops have been allowed to stay open during Covid lockdowns, as they have been deemed “essential”.
Parisians have also embraced Paris Respire – first begun in 2016 – which has seen successful street closures across the city to allow citizens to experience active transport and cleaner air on their streets, initially for a day a year and now applying to various arrondissements in Paris and in many cases resulting in whole neighhourboods being closed to cars every Sunday. And in fact, in a Parisian parallel to Copenhagen’s experience, you find shops opening up on Sundays to serve the flâneurs, cyclists, dog walkers and rollerskaters who now can circulate in complete peace and tranquility, without losing the skin off their heels crossing a zebra crossing thanks to an impatient or speeding motorist.
But, as we shall see later (skip to #12 in Part three), the trend has in fact even spurred some new French words!
It is also worth noting that Paris is just 9.5km north-south and 18km east-west: its compactness means 60.5% of trips are made on foot and another 27.3% of trips involve transit. In fact, it is the walkable city par excellence, and indeed, a few literary souls have pontificated on it too:

III. London: how not to be late for tea with the Queen
We cannot help thinking about a slightly different situation over the pond in L O N D O N … where we find another large European city that is also still trying to make the low numbers a little less low.
Londoners’ cycling modal share has been increasing but it is still in the fairly abysmal 2%.
And bike travels made a significant jump only after congestion charging was introduced for central London in 2003 – in fact, for years the cycling modal share in London was below 1% – and has continued a steady (if not spectacular) upwards climb since then.
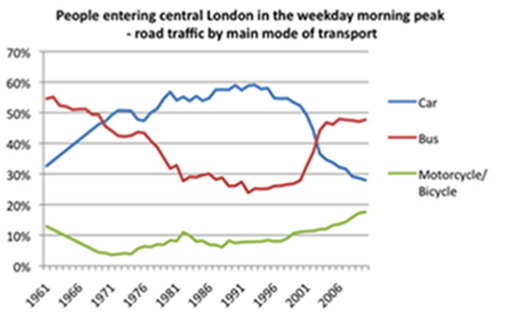 Source: https://londontransportdata.wordpress.com/category/subject/modal-share/
Of course, like Paris, London’s streets have many Roman roads (the famous Oxford Street is just one example) and so the city was not “designed” from scratch with a free hand which does mean that putting dedicated bike lanes in place may have some difficulties.
We did an experiment: most people who have tried to get from one place to another within Zone 1 of London would probably agree that cars often take longer and that coming from the east to the West End often takes longer than coming from the west.
We tested this out in a more scientific way with this app called TravelTime: say if you need to get to Buckingham Palace to have afternoon tea with the Queen at four o’clock on a week-day and you have only 25 minutes travel time, you can:
- Bike from Kings Cross – but if driving from Kings Cross you will not arrive in time (here’s the Buckingham Palace 25-minute driving TravelTime map);
- Arrive with time to spare if driving from within a radius of 5.5km from either the south or the north but possibly not if coming from the east or the west.
- Just make it if driving from a distance of 5.5km from almost any point west of the Palace but there’s a good chance you’d be late if coming from the east.
Londoners tend to do quite a bit of walking indeed: the numbers show that commuting by walking is at a 29% share – even if this compares with 65% in Paris, a smaller and more compact city.
Another fun thing – and of more serious even if less royal import – is to look at suburbs within an hour’s walking distance from the City. There are 20 suburbs that fall within this definition, according to lettings management platform Howsy, which has called these “walk to work hotspots”, with the cheapest suburbs within an hour’s walking distance to City being Mile End and the most expensive (surprise surprise) Mayfair. On average, these 20 suburbs commands a 18% premium to the average London monthly rent (and here’s an interactive map of these 20 suburbs made by Carto).
Informal surveys show commute time data by borough in London – with the outer boroughs seeing an average commute time that is double that of the inner boroughs with the shortest average commute time. In short, Kensington and Chelsea is the most commutable borough, followed by Richmond-upon-Thames, Westminster, Islington and Camden. Well, we the team at Madeleine’s have lived in three of the five and Madeleine herself (rather famously) walked to work when she used to live in London ….
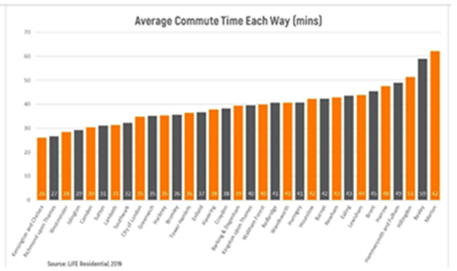
Source: https://liferesidential.co.uk/news/which-londons-most-commutable-borough/
Not only is distance a factor in commuting time, it affects what Transport for London (TfL) calls the % of commuters who use the “active mode”; those who live in the City of London are 90%+ commute by “active” or public modes, while the boroughs with the lowest active-plus-public share are the “outer boroughs”, where the share of active-plus-public is just below 50%.
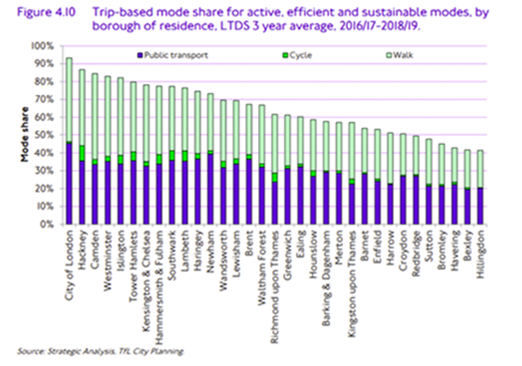 Source: Transport for London, Travel in London Report, 2019.
And then of course the boroughs that are well connected by public transport do much better on the active-plus-public share. TfL’s data show that people living in more well-connected areas (defined by TfL with an index known as “public transport access level” or “PTAL”) make more trips by public transport and by active modes (walking or cycling). The difference in use of cars is rather significant: over 50% (lowest connectivity areas) vs less than 20% (highest connectivity).

Source: Transport for London, Travel in London Report, 2019.
There is so much coordinate-by-coordinate information that is publicly available – find it here – that we found Buckingham Palace scores quite high. It got us wondering whether the Queen does do much walking for her errands … !
P.S. It has to be noted that the low cycling statistics notwithstanding, London’s Design Museum has always had a thing for bikes (bikes were always amongst the items on display), and finally proclaimed its love in full view with an exhibition on bicycles, Cycle Revolution (reviews here and here), one of the final exhibition in its “old” site, and it also gives detailed instructions to museum-goers on how to bike to the museum.
To be continued in Part II and Part III.


